 |
|
| Option Calculators and Stock Screeners |
|
|
|
|
|
|
Bull Call Calculator
The Bull Call Calculator can be used to chart theoretical
profit and loss (P&L) for bull call positions. Clicking on the chart icon  on the Bull Call Screener/Bull Put Screener loads the
calculator with a selected bull call or bull put position. on the Bull Call Screener/Bull Put Screener loads the
calculator with a selected bull call or bull put position.
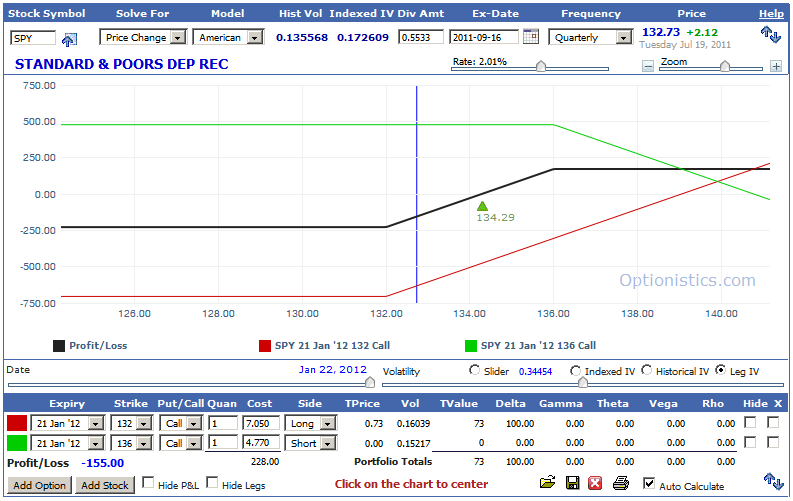
A bull call consists of a long call and a short call, and profits when the underlying security price rises.
The black line shows the P&L, which is the sum of the P&L for
the short call and long call positions. The green triangle  displays the approximate break-even point. General Help with the
calculator can be found here.
displays the approximate break-even point. General Help with the
calculator can be found here.
|
|
|
| Data Provided by HistoricalOptionData.com |
|
online probability calculator
trading tips
stock market term
dividend
stock trading tools
stock volume chart
best stock trades
stock market morning report
stock symbol look up
stock market options trading tutorial
stock market symbol search
basics of stocks
introduction to options trading
leverage stock market
stock bid
put strike price
option strike price
the stock market
option strangle
butterfly spread example
stock market term
stock growth rate
|
| Optionistics is not a registered investment advisor or
broker-dealer. We do not make recommendations as to particular
securities or derivative instruments, and do not advocate the
purchase or sale of any security or investment by you or any
other individual. By continuing to use this site, you agree to
read and abide by the full disclaimer.
|
|

