 |
|
| Option Calculators and Stock Screeners |
|
|
|
|
|
|
The 52 Week High/Low Volatility Screener identifies options with implied volatility at a 52 week high or a 52 week low.
Stocks will often have unusually high volatility just prior to the
payout of a dividend. It can sometimes be profitable to sell options
for the high premiums when this occurs, then buy the options back when
the volatility subsides.
These high volatility dates can be filtered out of the screen results
by selecting the 'Ignore Ex-dividend Dates' checkbox. When this
checkbox is checked, highs or lows in implied volatility that occur on
the days preceding an ex-dividend date are ignored.
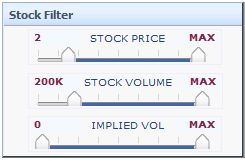 |
Stocks can be filtered by price, volume, and implied volatility.
- Price Range - set the sliders to the minimim and maximum prices. Only stocks with a price between the minimum and maximum prices will be included in the screen.
- Stock Volume - Only stocks with a daily volume between the minimum and maximum volume will be included in the screen.
- Implied Volatility - only show stocks with an implied volatility in the selected range
|
| *Tip: A slider can be moved by clicking anywhere on the
slider bar. |
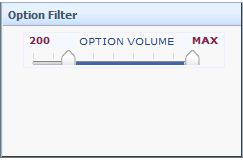 |
Stocks can be filtered by total Option Volume.
-
Option Volume - set the sliders to the minimum and maximum total
volume of all contracts on the high/low date. Only stocks with total
option volume in the selected range on the high/low date will be
included in the screen.
|
*Tip: Click the chart button  to show the spread in the Strategy Calculator.
 |
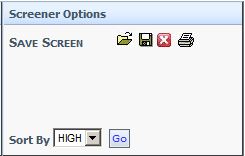 |
- Saving a Screen - Subscribers can save screen parameters and recall
these parameters later. Screener type, slider values, and sort order parameters are saved. The date of the screen is
not saved. When a saved screen is opened, the parameters will be applied to
the currently selected date.
-
Sort By - the order in which the screener results are displayed. The
results may also be sorted by clicking on column headers. Sorting by
clicking on column headers only sorts the data that is already in the
report.
- HIGH - List stocks that have recently hit their 52 week implied volatility high.
- LOW - List stocks that have recently hit their 52 week implied volatility low.
|

- Stock - the underlying stock symbol
- Stock Name - the underlying stock name
- High/Low Date - the date that the high or low volatility occured
- Stock Price - the underlying stock price
- Stock Volume - the underlying stock volume
- Option Volume - the sum of all underlying option volume
- Implied Volatility - Contract implied volatility.
- Price Change - the change in price on the high/low date
Data is updated nightly.
Go back to the 52 Week High/Low Volatility Screener.
|
|
|
| Data Provided by HistoricalOptionData.com |
|
open interest example
skew volatility
margin leverage
covered call options
stocks risks
option trading
stock market investing advice
stocks with best dividends
online option calculator
open interest percentage
investment portfolio analysis
leverage with options
option basics
puts and calls
trading with leverage
put call ratio indicator
high growth stock
option volume data
volume vs open interest
what is volatility skew
basics of stock trading
|
| Optionistics is not a registered investment advisor or
broker-dealer. We do not make recommendations as to particular
securities or derivative instruments, and do not advocate the
purchase or sale of any security or investment by you or any
other individual. By continuing to use this site, you agree to
read and abide by the full disclaimer.
|
|
