
Strategy Calculator Help
The Strategy Calculator is a tool that can be used to chart multi-leg option strategies. As many as eight option legs can be added, as well as an optional stock position. The Strategy Calculator will compute the Profit & Loss (P&L) for the overall strategy. Non-subscribers can have up to four legs. The Strategy Calculator can be used to chart covered calls, covered puts, spreads, and other complex option positions. The theoretical value of the the combined positions, i.e. a strategy, can be charted with prices calculated using either historical volatility, indexed volatility, contract volatility, or volatility specified using the volatility slider.
Loading a Stock
Enter the Stock Symbol of the underlying stock you wish to graph in text box in the the top left corner of the chart. Press enter or click this button
 to change the graph. This button
 refreshes the page.
Solve For
The profit and loss can be calculated for either "Days Left" or "Price Change". These selections can be chosen using the "Solve For" drop down menu.
Model Type
You can select either the "American" or "European" model from the next drop down menu.
Volatility
The Historical Volatility and Indexed Implied Volatility are displayed next to the model drop-down selections.
Dividends
The dividend amount and the ex-date of underlying security can be entered in the next two boxes. You can select the dividend frequency from the next drop down menu. The dividend frequency is estimated from previous dividend payouts.
Price Quote
The price quote is displayed in the upper right hand corner of the calculator. Price quotes are delayed by at least 15 days for non-subscribers.
Risk Free Rate
The risk free rate can be adjusted using the Rate slider.

Zoom
The zoom slider zooms the graph in and out. Clicking on the chart will center the page.
Add Option
Clicking this button adds an option leg to the graph.
Add Stock
Click Add Stock to add a stock position. Only one stock position can be added.
Hide P&L
Checking off this box hides the strategy P&L line from the graph, individual P&L will remain visible.
Hide Legs
Checking off this box hides a specific leg from your graph. Hiding all legs shows only the P&L line.
Auto-Calculate
Checking off this box forces the P&L line to be recalculated each time a menu option is changed.

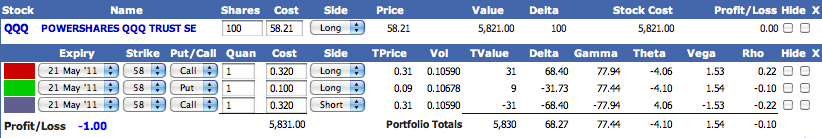
Adding and Hiding Legs
Each leg is listed below the graph. The Expiry Date, Strike Price, Put/Call, Quantity, Cost, and Side can be entered here. The Theoretical Price, Volatility, Theoretical Value ("TValue)", and the Greeks are displayed for each leg.
Each leg can be hidden the checking off the "Hide" box on the far right. Each leg is also listed below the graph. The Expiry Date, Strike Price, Put/Call, Quantity, Cost, and Side can be entered here. Click the checkbox labeled 'X' to delete the leg. If 'Auto-Calculate' is selected the leg will be deleted immediately.
Expiry Date
The Expiration Date of a contract can be selected from the first drop down menu. Only the actual applicable expirations will be listed.
Strike Price
The applicable Strike Prices will appear in the drop-down menu after the Expiry Date is selected.
Date
The "As-Of" date can be changed by moving the slider. The "As-Of" date represents the time to expiration and is used to calculate the strategy P&L. The default date corresponds to the date of the price quote, and differs based on the subscription level. The most current data is available to subscribers.
Volatility
The volatility that is used to calculate P&L can be one of Indexed IV, Historical IV, Leg IV, or the volatility selected using the slider labeled "Volatility".
- "Historical IV" - use the Historical Volatility, shown at the top of the calculator, to compute the P&L and the theoretical price for each leg.
- "Indexed IV" - use the Indexed Implied Volatility, shown at the top of the calculator, to compute the P&L and the theoretical price for each leg.
- "Leg IV" - use the volatility implied from the price of individual contracts. This volatility can be different for each option leg in the strategy.
- "Slider" - The value of the Volatility slider, (0.34454 in the example below), is applied to all legs.

Reading the Graph
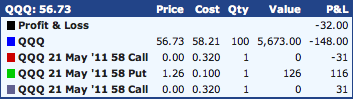
When solving for price, the graph charts the underlying price on the X-axis and the profit and loss (P&L) on the Y-axis. Hovering over a point on the graph displays a tool tip similar to the one illustrated below.
Break Even Point
Small green triangles are displayed on the chart at the points where the P&L is zero.
Saving Strategies
Subscribers can save strategies by clicking the Save  button. A dialog will appear and a name can be assigned to the chart. Enter a name in the text box and click the Save button.
Open an Existing Strategy
Subscribers can open strategies by click the Open  button. A popup menu will appear that will list saved strategies. Select the desired strategy and click the Open button. The chart will be restored to the saved state.
Deleting an Existing Strategy
Click the Delete  button. A popup menu will appear that will list saved strategies. Select the desired strategy and click the Delete button. The chart will be removed from the system
Printing a Chart
Click the print  button to print the chart. The chart will be redrawn without menus or page banners. Click the print icon again to print the chart. Clicking
  will cancel printing and return to the previous screen. Reducing margins to .2 inches or smaller may be required for some printers. For best results, configure your printer to print in landscape mode.