The Volatilty Skew can be charted for any symbol that has options. Enter the symbol in the text box labeled Symbol and click 'Go'. The implied volatility for each strike prices will be charted. Data for boths puts and calls will be displayed.
Contracts that are extremely deep in or out of the money are omitted, as are contracts for which there is insufficient data to compute volatility. If there is insufficient volatility data for strikes near the money a warning will be displayed in lieu of a chart.
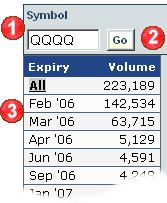 |
1) | Enter the symbol |
| 2) | Click Go | |
| 3) | Optional: limit the chart to a specific expiration by clicking on the desired expiration date | |
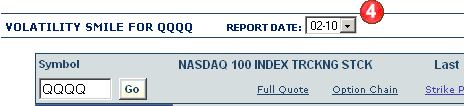
| 4) | Optional: Select the report date. Your subscription level determines how much data is available. | |
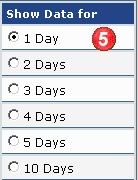
| 5) | Volatility skew can be viewed using 1 to 10 days of data. This feature is useful for examining skew on lightly traded options, or for detecting trends in skew data. | |
 |
||
|
|
|
Implied volatility data can be displayed for all expiration dates or for an individual expiration date.
|