 |
|
| Option Calculators and Stock Screeners |
|
|
|
|
|
|
The Volatility Skew screener
identifies call and put contracts at with the same strike, price, and underlying
stock that have disparities in the implied volatility. Differences in implied
volatility for similar option contracts can be an indication of a bias for
future stock direction. This Volatility Skew screener offers numerous methods for screening options:
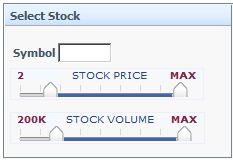 |
Stocks can be filtered by price and volume.
- Symbol - Optionally enter a stock symbol to limit the screen to spreads on the underlying stock.
- Price Range - set the sliders to the minimim and maximum prices. Only stocks with a price between the minimum and maximum prices will be included in the screen.
- Stock Volume - Only stocks with a daily volume between the minimum and maximum volume will be included in the screen.
|
| *Tip: A slider can be moved by clicking anywhere on the
slider bar. |
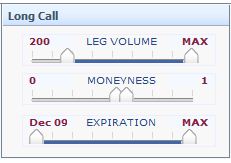 |
Options can be filtered by Volume, Moneyness and Expiration
- Leg Volume - set the sliders to the minimim and maximum volume of the long contract. If
only one volume slider is available for an option it will apply to all the options in the spread.
- Moneyness - refers to the number of strikes an option is in or out of the money.
Options with a moneyness of zero are At The Money (ATM). Strike prices
increase as the moneyness becomes more positive. Strike prices decrease as the
moneyness becomes more negative. For call spreads, a positive number is Out of The Money (OTM).
Negative numbers are In The Money (ITM). For put spreads, a positive number is
In The Money (ITM) and negative numbers are Out of The Money (OTM). See Moneyness.
- Expiration - include only options that expire between the start of the
earlier month and the end of the later month. Options expiring on any date in
the selected months may be included in the screen, including weekly options,
quarterly options, and options that expire on odd days (e.g. VIX options).
Both expiration sliders may be set in the same month. All options expiring in
the selected month will be considered in the screen.
|
| *Tip: Subscribers can save reports. |
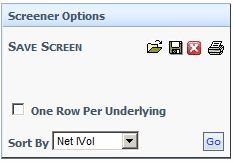 |
- Saving a Screen - Subscribers can save screen parameters and recall
these parameters later. Screener type, slider values, symbol, sort order, and
"One Row Per underlying' parameters are saved. The date of the screen is
not saved. When a saved screen is opened, the parameters will be applied to
the currently selected date.
- Sort By - the order in which the screener results are displayed. Up to 100
rows are included in each screen. The results may be sorted by clicking on
column headers. Sorting by clicking on column headers only sorts the data that
is already in the report.
- Largest Skew - the difference in the volatility of the two legs wihtout
respect to whether the call implied volatility or the put implied volatility
is higher.
- Bearish - order by greatest difference in the volatility where put implied
volatility is higher than call volatility.
- Bullish - order by greatest difference in the volatility where call
implied volatility is higher than put volatility.
|
- Stock - the underlying stock symbol
- Stock Price - the underlying stock price
- Fields for both the Short and Long Leg:
- Short Expiration Date
- Long Expiration Date
- Strike
- Option Price
- Put vs. Call
- Net IVol - Net implied volatility; the difference in the implied volatility of the two option contracts
Excluded Contracts
Contracts that have any one of the following conditions are excluded:
- no bid
- no volume
- no open interest
- no contracts in the cycle. See Option Cycles.
Data is updated nightly.
|
|
|
| Data Provided by HistoricalOptionData.com |
|
covered call strategy
oi percentage change
leverage futures
options straddle
open interest example
stock market risk
call put ratio
learn stock trading
call options
stock basics
diagonal spread
put call ratio definition
open interest percentage change
option profit calculator
trading leverage
option open interest
what is an option straddle
ticker symbol lookup
stock market strategies
stock option tutorial
option basics
bear calls
stock analysis
|
| Optionistics is not a registered investment advisor or
broker-dealer. We do not make recommendations as to particular
securities or derivative instruments, and do not advocate the
purchase or sale of any security or investment by you or any
other individual. By continuing to use this site, you agree to
read and abide by the full disclaimer.
|
|

