A Stock has More Than One Volatility
| Related Links |
|---|
| Volatility Skew Chart |
| Volatility Skew Finder |
| Strike Pegger |
What is Skew?
Theoretically, all options for a stock should trade with the same measure of volatility and at the money calls and puts with the same strike and expiration should have the same price. In practice, the demand for individual option contracts can drive up the price of some of the options on a stock and not others.Higher call volume does not necessarily mean more call buyers. Call traders may be selling calls. It is not the disparity in volume, but the disparity in the volatility of calls vs. puts that indicates the side (buy vs. sell ) that call traders are taking. If call volatilities are higher than put volatilities, this indicates that traders are buying calls. An excess of call buyers reveals a skew that favors the stock price going up. A similar argument can be made for expensive puts.
High volume and low volatility indicates that option contracts are being sold. High volume and high volatility indicates option contracts are being purchased.
There are two types of skew, time skew and strike skew. Time skew is a measure of the disparity of option volatility for option contracts with the same price but different expirations. Strike skew is the measure of the disparity of option volatility for option contracts with different strikes but the same expiration.
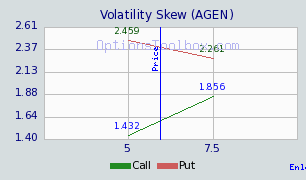
Traditional models for option pricing tend to price out of the money options lower than near the money options. As a result, computing volatility from the current price of options results in inflated volatilities as options become deeper in or out of the money, which results in the skew chart taking on a smile like curve. Nonetheless, the cost of calls and puts should maintain parity at the same strike, that is, calls and puts at the same strike should have the same volatility. Often that is not the case, as can be seen in the Mar 16, 2006 Volatility Skew chart for AGEN below. The in the money puts were significantly more expensive than similar calls, indicating both put buying and/or call selling at both the 5 and 7.5 dollar strikes. AGEN dropped approximately 50% in the 2 week period that followed.
 |
 |
Higher volatilities in near the money or in the money calls vs. puts indicates an abundance of call buyers, which is conventionally viewed as bullish. An abundance of volume in the out of the money call, coupled with low volatility, reveals out of the money call sellers. Such activity may not be a strong indicator of direction, except to suggest that options traders do not anticipate the stock rising beyond the out of the money call's strike price. This is a neutral indicator.
The skew is a valuable indicator that shows option trader's biases towards the stock. Whatever notion you may have regarding the impending direction of a stock's price, check the volatility skew first, and see where the option traders are putting their money.
Volatility Skew charts are only available to registered members.
Finding Volatility Skew
Stocks with disparities in call and put volatilities can be identified
using the Volatility Skew Finder. The Volatility Skew Finder can find stocks with greater
volatilities in the calls vs. puts, which is bullish, and puts vs. calls, which is bearish.
The Volatility Skew Finder is only available to registered members.


