 |
|
| Option Calculators and Stock Screeners |
|
|
|
|
|
|
Bear Call Calculator
The Bear Call Calculator can be used to chart theoretical
profit and loss (P&L) for bear call positions. Clicking on the chart icon  on the Bear Call Screener or Bear Put Screener loads the
calculator with a selected bear call or bear put position. on the Bear Call Screener or Bear Put Screener loads the
calculator with a selected bear call or bear put position.
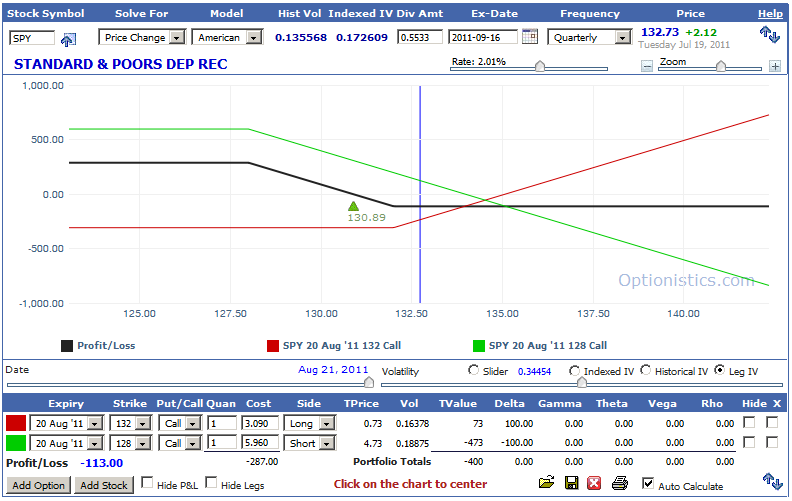
A bear call consists of a long call and a short call, and profits when the underlying security price falls.
The black line shows the P&L, which is the sum of the P&L for
the short call and long call positions. The green triangle  displays the approximate break-even point. General Help with the
calculator can be found here.
displays the approximate break-even point. General Help with the
calculator can be found here.
|
|
|
| Data Provided by HistoricalOptionData.com |
|
basics of options
option tutorial
skew volatility
sell covered calls
butterfly diagonals
what is a stock option
best covered calls
stock market terms explained
free stock quotes
low risk option trading strategies
trade options tutorial
put options
bull call spread
historic option prices
download stock market data
stock market ticker symbols list
article about the stock market
risk reversal option strategy
covered calls options
put option risk
|
| Optionistics is not a registered investment advisor or
broker-dealer. We do not make recommendations as to particular
securities or derivative instruments, and do not advocate the
purchase or sale of any security or investment by you or any
other individual. By continuing to use this site, you agree to
read and abide by the full disclaimer.
|
|

