 |
|
| Option Calculators and Stock Screeners |
|
|
|
|
|
|
Bear Put Calculator
The Bear Put Calculator can be used to chart theoretical
profit and loss (P&L) for bear put positions. Clicking on the chart icon  on the Bear Call Screener or Bear Put Screener loads the
calculator with a selected bear call or bear put position. on the Bear Call Screener or Bear Put Screener loads the
calculator with a selected bear call or bear put position.
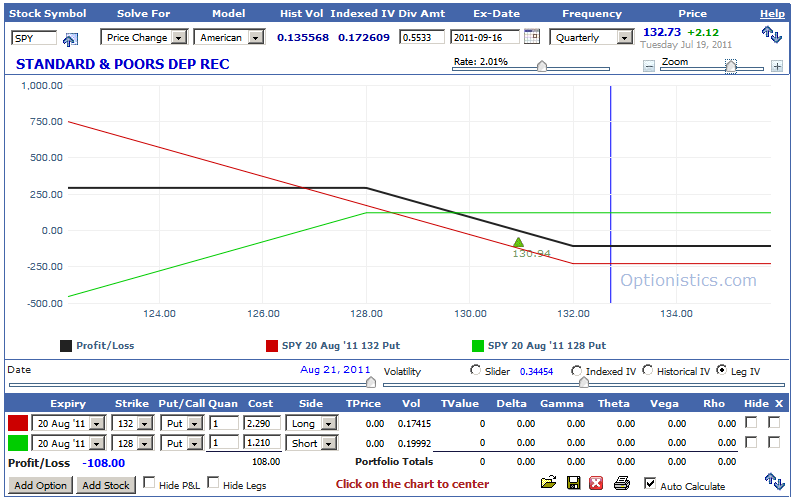
A bear put consists of a long put and a short put, and profits when the underlying security price falls.
The black line shows the P&L, which is the sum of the P&L for
the short put and long put positions. The green triangle  displays the approximate break-even point. General Help with the
calculator can be found here.
displays the approximate break-even point. General Help with the
calculator can be found here.
|
|
|
| Data Provided by HistoricalOptionData.com |
|
historical stock value
stock that pay dividends
option probability calculator
black scholes calculator
unusual option volume
stock market investing advice
put call ratio indicator
dividend stock list
options screener
what is open interest options
stock quote history
portfolio trackers
what is a bear call spread
volatility in stock market
stock value analysis
butterfly put
how to write covered calls
value of stock
dividend paying stocks
put spread
|
| Optionistics is not a registered investment advisor or
broker-dealer. We do not make recommendations as to particular
securities or derivative instruments, and do not advocate the
purchase or sale of any security or investment by you or any
other individual. By continuing to use this site, you agree to
read and abide by the full disclaimer.
|
|

