

A summary of the most recent trading day's closing numbers is displayed, along with two charts. The chart on the left shows the stock price (green), historical volatility (red), and a composite measure of the implied volatility (black). A chart of the daily volume is displayed beneath the price and volatility chart.
The chart on the right shows the Strike Pegger for free and standard subscriptions. Premium subscribers will see a plot of volatility skew.
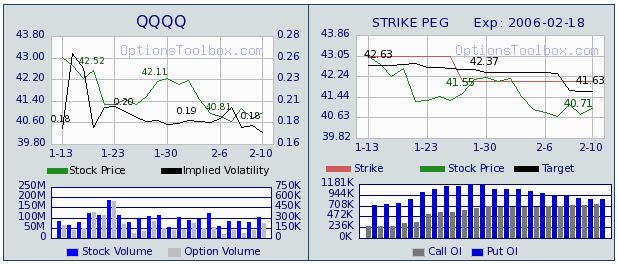 |
The Strike Pegger shows the Price, Strike Peg, and Target Price based on a weighted put call ratio. For additional help on the Strike Pegger, click on the chart. A larger version of the chart will be displayed. Links to additional information and help are displayed along with the larger chart.
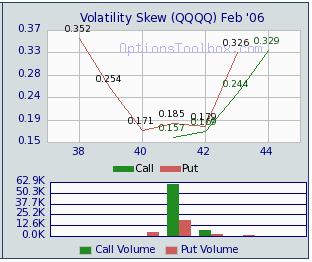 |
Volatilty Skew shows the implied volatilities of near the
money options by strike price for the selected security. For additional help on
Volatility Skew, click on the chart. A larger version of the chart will be displayed. Links to additional information and help are displayed along with the larger chart.
28 calendar days of historical data are provided. Summaries of complex option trades for the selected security are also displayed. Trades are chosen based on their potential for profitability and all computations are based on closing prices. Each complex option summary has an additional link, labeled more.... Clicking this link will show an expanded report for the corresponding complex option type for the current security. |
To display data for a different security, enter a symbol in text box labeled "Enter Symbol" and click the "Show Analysis" button.
The option chain for the security may also be displayed by clicking the "Option Chain" link.
Return to the Stock Quotes page.