 |
|
| Option Calculators and Stock Screeners |
|
|
|
|
|
|
Expensive puts and expensive calls are option contracts that have high premiums.
The Volatility Screener offers numerous methods for screening expensive option
contracts:
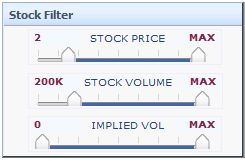 |
Stocks can be filtered by price and volume.
- Price Range - set the sliders to the minimim and maximum prices. Only stocks with a price between the minimum and maximum prices will be included in the screen.
- Stock Volume - Only stocks with a daily volume between the minimum and maximum volume will be included in the screen.
- Implied Volatility - only show stock with an implied volatility in the
selected range
|
| *Tip: A slider can be moved by clicking anywhere on the
slider bar. |
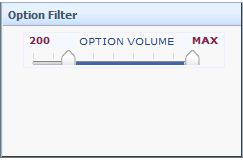 |
Options can be filtered by Volume, Moneyness and Expiration
- Option Volume - set the sliders to the minimum and maximum volume of all
contracts. Only stocks with total option volume in the selcted range will be
evaluated in the screen.
- Moneyness - refers to the number of strikes an option is in or out of the money.
Options with a moneyness of zero are At The Money (ATM). Strike prices
increase as the moneyness becomes more positive. Strike prices decrease as the
moneyness becomes more negative. For call spreads, a positive number is Out of The Money (OTM).
Negative numbers are In The Money (ITM). For put spreads, a positive number is
In The Money (ITM) and negative numbers are Out of The Money (OTM). See Moneyness.
- Expiration - include only options that expire between the start of the
earlier month and the end of the later month. Options expiring on any date in
the selected months may be included in the screen, including weekly options,
quarterly options, and options that expire on odd days (e.g. VIX options).
Both expiration sliders may be set in the same month. All options expiring in
the selected month will be considered in the screen.
|
*Tip: Click the chart button  to show the spread in the Strategy Calculator.
 |
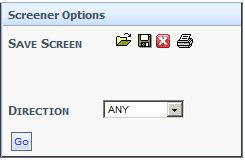 |
- Saving a Screen - Subscribers can save screen parameters and recall
these parameters later. Screener type, slider values, and sort order parameters are saved. The date of the screen is
not saved. When a saved screen is opened, the parameters will be applied to
the currently selected date.
- Sort By - the order in which the screener results are displayed int Change
in Volatility screen. The results may also be sorted by clicking on
column headers. Sorting by clicking on column headers only sorts the data that
is already in the report.
- Any - Show the maximum change in volatility, regardless of whether the
change represents and increase or decrease in volatility.
- Increase - Show the maximum increase in volatility.
- Decrease - Show the maximum decrease in volatility.
|

- Stock - the underlying stock symbol
- Stock Name - the underlying stock name
- Stock Price - the underlying stock price
- Stock Volume - the underlying stock volume
- Option Volume - the sum of all underlying option volume
- Implied Volatility - Contract implied volatility.
- IVol Change - the change in implied volatility
When a volatility screen is applied to delayed data, the High/Low Change and
% Change columns are displayed.
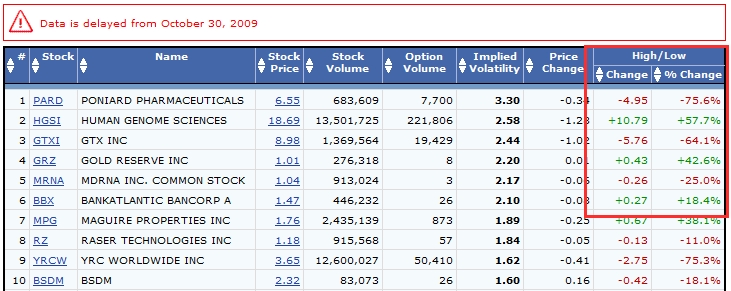
- High/Low Change is the maximum dollar amount that the underlying stock has
moved either up or down since the report date. This may include intraday
highs or intraday lows.
- High/Low Change % is the High/Low Change relative to the price of the
underlying stock on the report date.
Excluded Contracts
Contracts that have any one of the following conditions are excluded:
- no bid
- no volume
- no open interest
- no contracts in the cycle. See Option Cycles.
Data is updated nightly.
|
|
|
| Data Provided by HistoricalOptionData.com |
|
strike price of options
basics of options trading
stock exchange symbols
strategy calculator
best stocks for dividends
historical options prices
change in open interest
stock value calculator
historical option prices
stocks dividend
butterfly option spread
strike price stock options
the risk of trading
bear call spread
option strangle
microsoft stock ticker symbol
stock trading basics
call strike price
iron condor
market advice
|
| Optionistics is not a registered investment advisor or
broker-dealer. We do not make recommendations as to particular
securities or derivative instruments, and do not advocate the
purchase or sale of any security or investment by you or any
other individual. By continuing to use this site, you agree to
read and abide by the full disclaimer.
|
|
