 |
|
| Option Calculators and Stock Screeners |
|
|
|
|
|
|
Calendar Put Spread Calculator
The Calendar Put Spread Calculator can be used to chart
theoretical profit and loss (P&L) for a calendar put
position. Clicking on the chart icon  on the Calendar Put Spread
screener loads the strategy calculator with the selected calendar
put. on the Calendar Put Spread
screener loads the strategy calculator with the selected calendar
put.
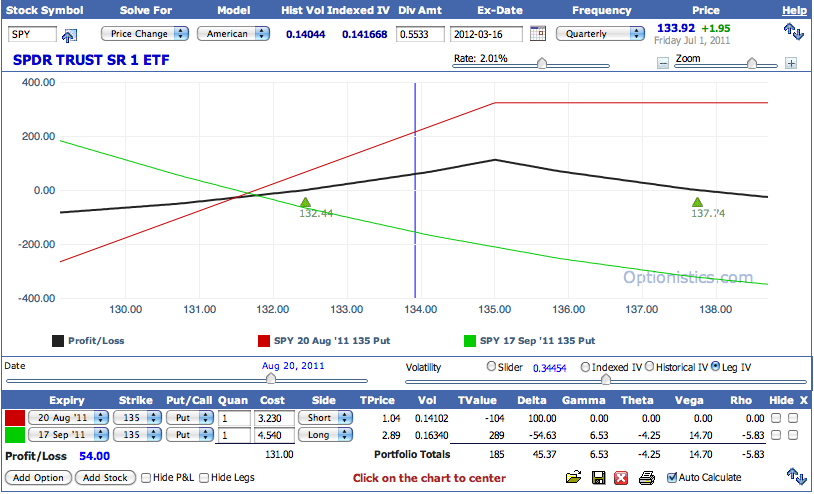
A calendar put spread consists of two puts with the same strike price
but different expirations. The long put expires after the short
put. The position will profit if the underlying security price does
not change much. The value of the short leg will decay faster than the
value of long leg. The long leg can be sold when the short leg expires.
In this example, the green triangles  show the break-even points as of August 20, when the
near term leg expires. General Help with the calculator can be found
here. show the break-even points as of August 20, when the
near term leg expires. General Help with the calculator can be found
here.
|
|
|
| Data Provided by HistoricalOptionData.com |
|
what is a strike price in options
stock dividend list
stock market information
stock market dictionary
look up stock symbols
strike price stock options
stock risk management
stock calculator
stock prices
stock market trading strategies
ticker symbols
most volatile stocks
double diagonal calendar spread
download stock data
stock market risks
stock market growth
company stock history
leverage options
option trading tips
stock symbol list
dividends on stocks
|
| Optionistics is not a registered investment advisor or
broker-dealer. We do not make recommendations as to particular
securities or derivative instruments, and do not advocate the
purchase or sale of any security or investment by you or any
other individual. By continuing to use this site, you agree to
read and abide by the full disclaimer.
|
|

