Stock Option Calculators | |||||
|---|---|---|---|---|---|
Diagonal Put Spread Calculator
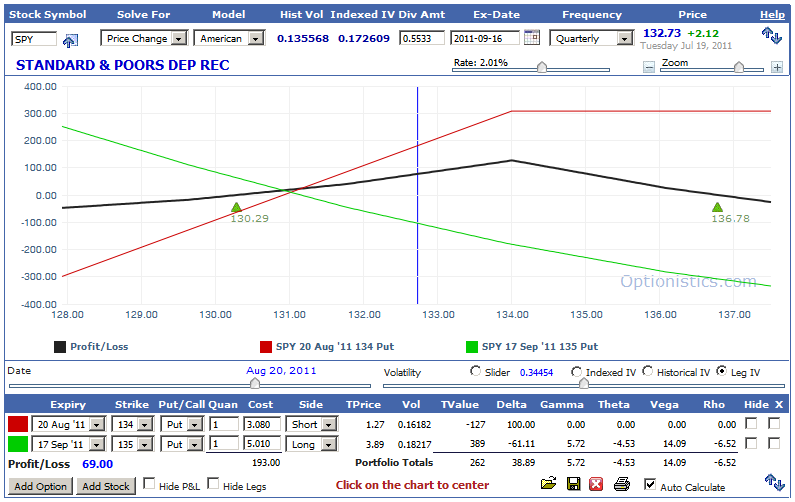
The Diagonal Put Spread Calculator can be used to chart
theoretical profit and loss (P&L) for a diagonal put
position. Clicking on the chart icon  on the Diagonal Put Spread screener loads the
strategy calculator with the selected diagonal put.

A diagonal put spread is similar to a calendar put spread in that it consists of two puts with the different expirations. The long put expires after the short put. The position will profit if the underlying security price does not change much. The value of the short leg will decay faster than the value of long leg. The long leg can be sold when the short leg expires.
The diagonal spread differs from a calendar spread because the strikes differ. A diagonal put spread can be structured to profit from either an increase or decrease in the underlying security price. The greater the spread between the strikes, the wider the range of profitability.
In this example, the green triangles  show the break-even points as of August 20, when the
near term leg expires. General Help with the calculator can be found
here.

