

Stock Option Calculators | |||||
|---|---|---|---|---|---|
Covered Put Calculator
The Covered Put Calculator can be used to chart theoretical
profit and loss (P&L) for covered put positions. To create a
covered put strategy add a short stock and a short put position to the
calculator. Clicking on the chart icon  on the Expensive Put/Put screeners loads the
calculator with a selected short put or short put. Clicking 'Add
Stock' will add the underlying stock to the calculator forming a
covered put or covered put position.
on the Expensive Put/Put screeners loads the
calculator with a selected short put or short put. Clicking 'Add
Stock' will add the underlying stock to the calculator forming a
covered put or covered put position.
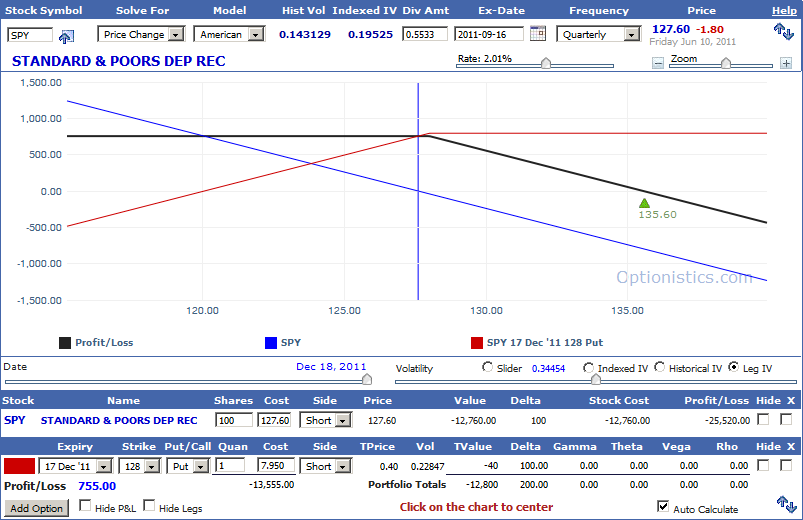
The black line shows the P&L, which is the sum of the P&L for the short stock and the short put positions. In this example, if the stock price stays below the short put strike price of $128, the position will net $755 per contract. The underlying security price will have to rise $7.95 before the position starts to lose money.
The green triangle  displays the approximate break-even point. General Help with the
calculator can be found here.
displays the approximate break-even point. General Help with the
calculator can be found here.